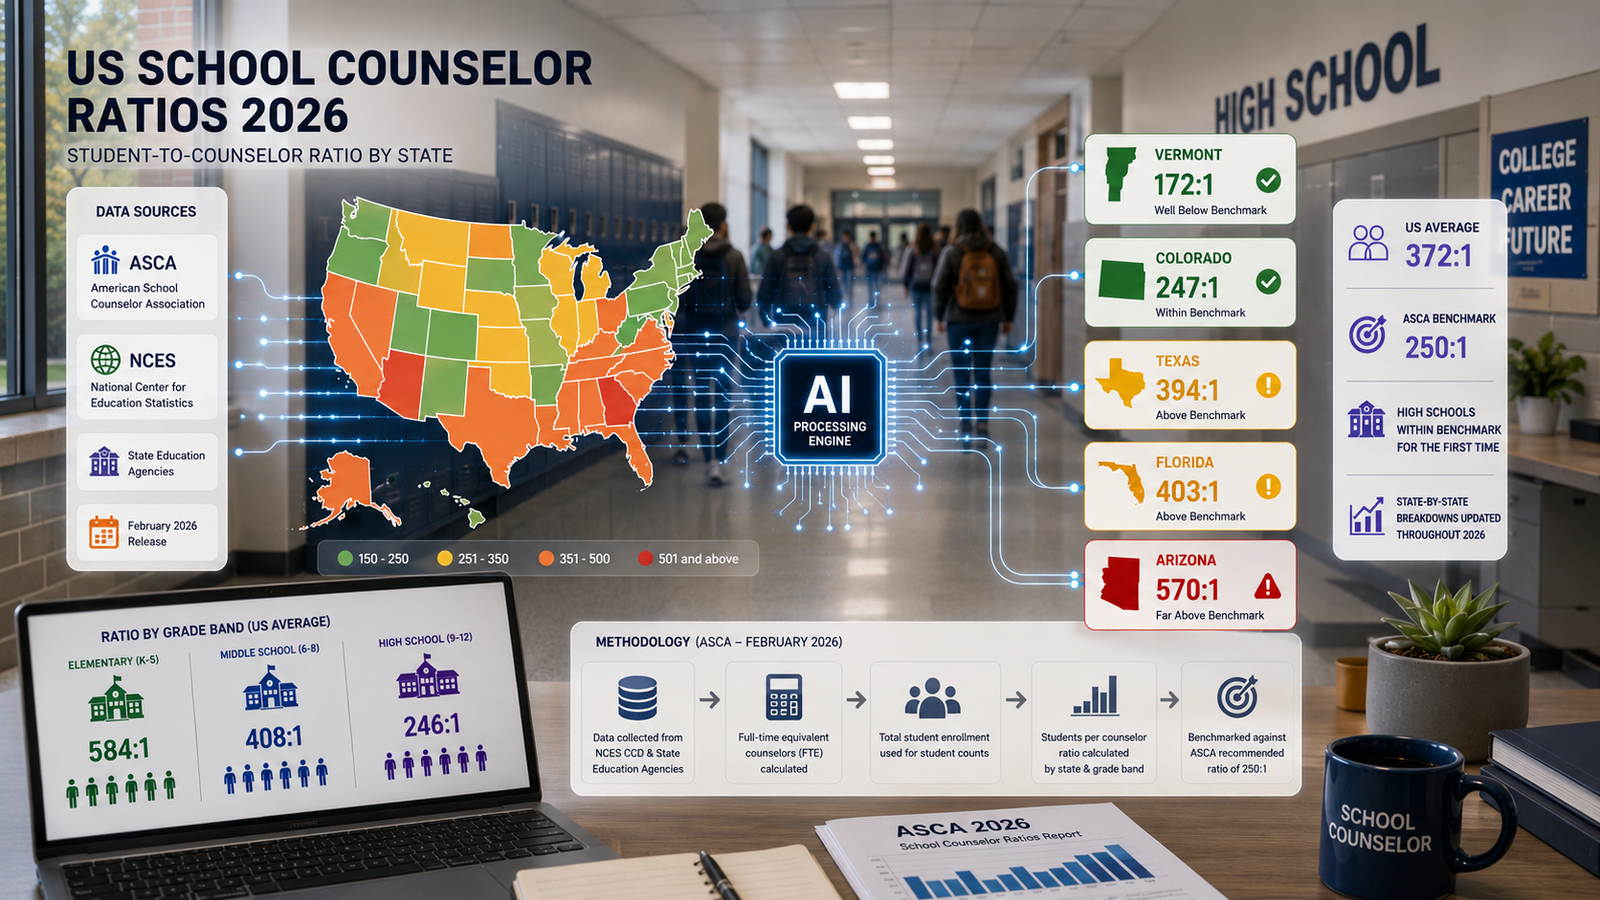
That split matters. A national average of 372:1 hides two very different realities: high schools that are, for the first time, adequately staffed by ASCA's own standard and elementary/middle schools that are still three times more overloaded than that.
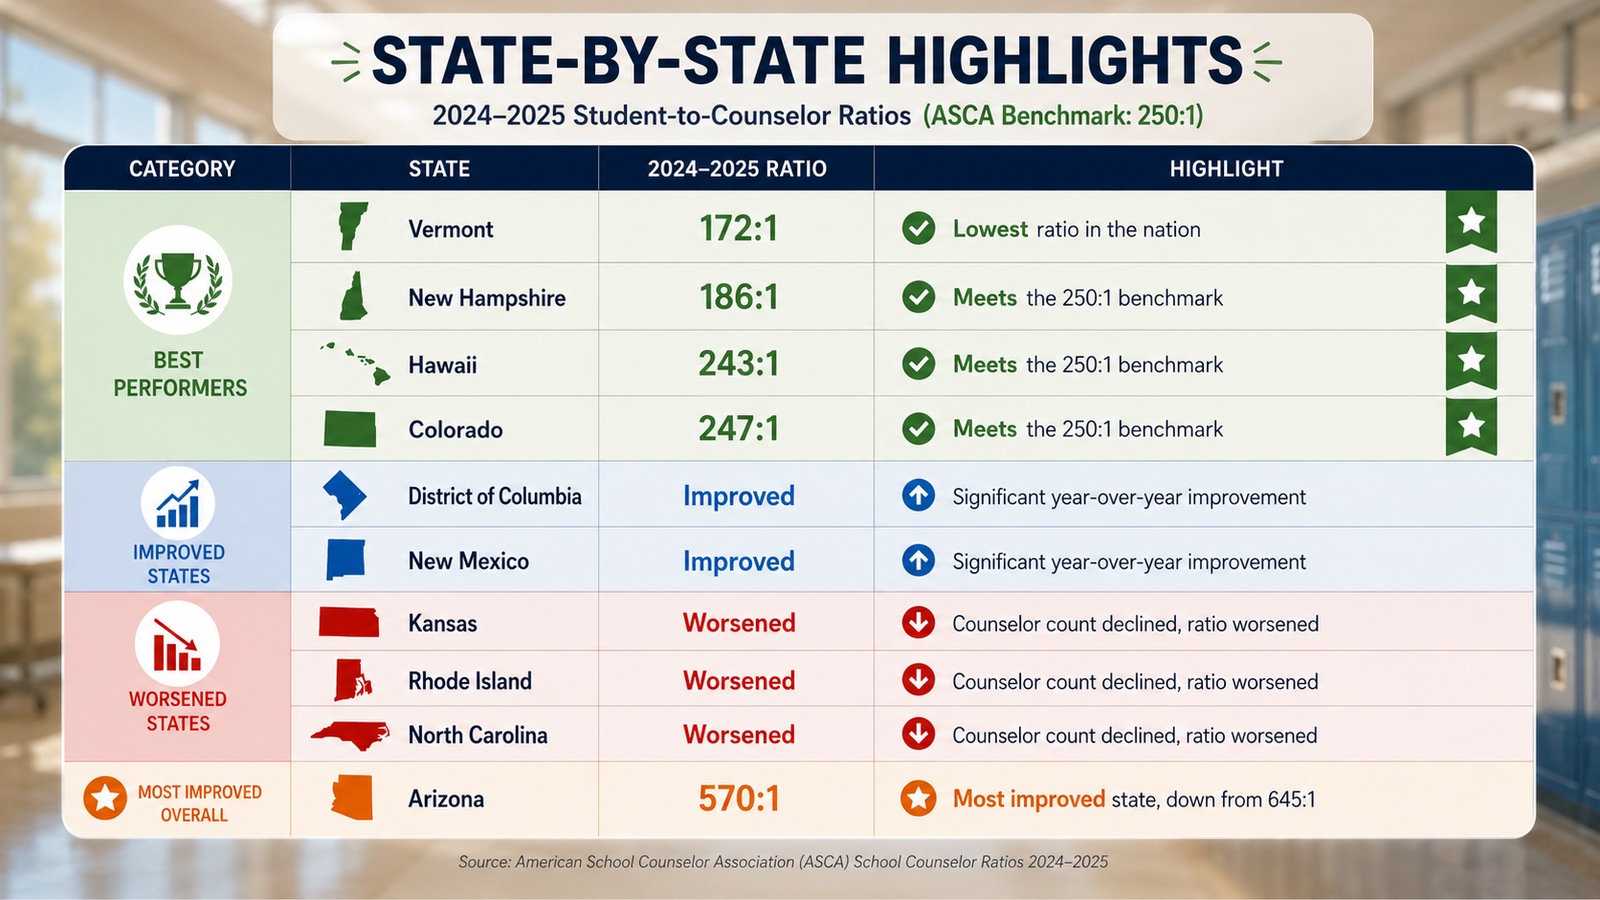
State-by-state comparison of the best-performing, most improved, and declining U.S. school counselor ratios based on the latest ASCA 2024–2025 data.
ASCA's 2024–2025 release draws on 35 states that report elementary/middle and secondary counselor counts separately. Within those states:
High school (grades 9–12): 195:1 to 224:1, the first time this range has fallen within the 250:1 benchmark.
Elementary/middle (PreK–8): 571:1 to 694:1, still far above the recommended level.
Fifteen states report a single combined counselor count, so exact grade-band ratios aren't available for every jurisdiction.
Methodology
ASCA calculates student-to-school-counselor ratios using data from the U.S. Department of Education's National Center for Education Statistics (NCES) Common Core of Data, specifically the State Nonfiscal Public Elementary/Secondary Education Survey, 2024–2025:
State ratios are computed as total students divided by the total school counselors at the state level.
Grade-band ratios are calculated only for the 35 states that report elementary/middle and secondary counselors separately.
Tennessee's 2024–2025 counselor count wasn't reported, so ASCA used 2023–24 data for that state in this release.
What the 2026 Data Means for Counselors and Schools
High schools are improving. For the first time, high school ratios in reporting states fall within ASCA's 250:1 benchmark.
State variation is extreme.Vermont's 172:1 next to Arizona's 570:1 shows how much a single "national average" can obscure real differences in student access.
This is exactly why a single headline ratio isn't enough on its own; the state and grade-band breakdowns turn it into something a district can actually act on.
We're building state-specific breakdowns with the same level of detail shown here, including a local stat block, rank, and year-over-year change, plus the dashboard filtered to your state. First up: Texas, Florida, California, New York, and Illinois.
Cross-Channel Coverage
This data has also been covered across CollegeFind AI's other channels: